See it live
Your whole backlog, one view
A real capture from a running RiskSonar environment. Your own categories and counts will look different.
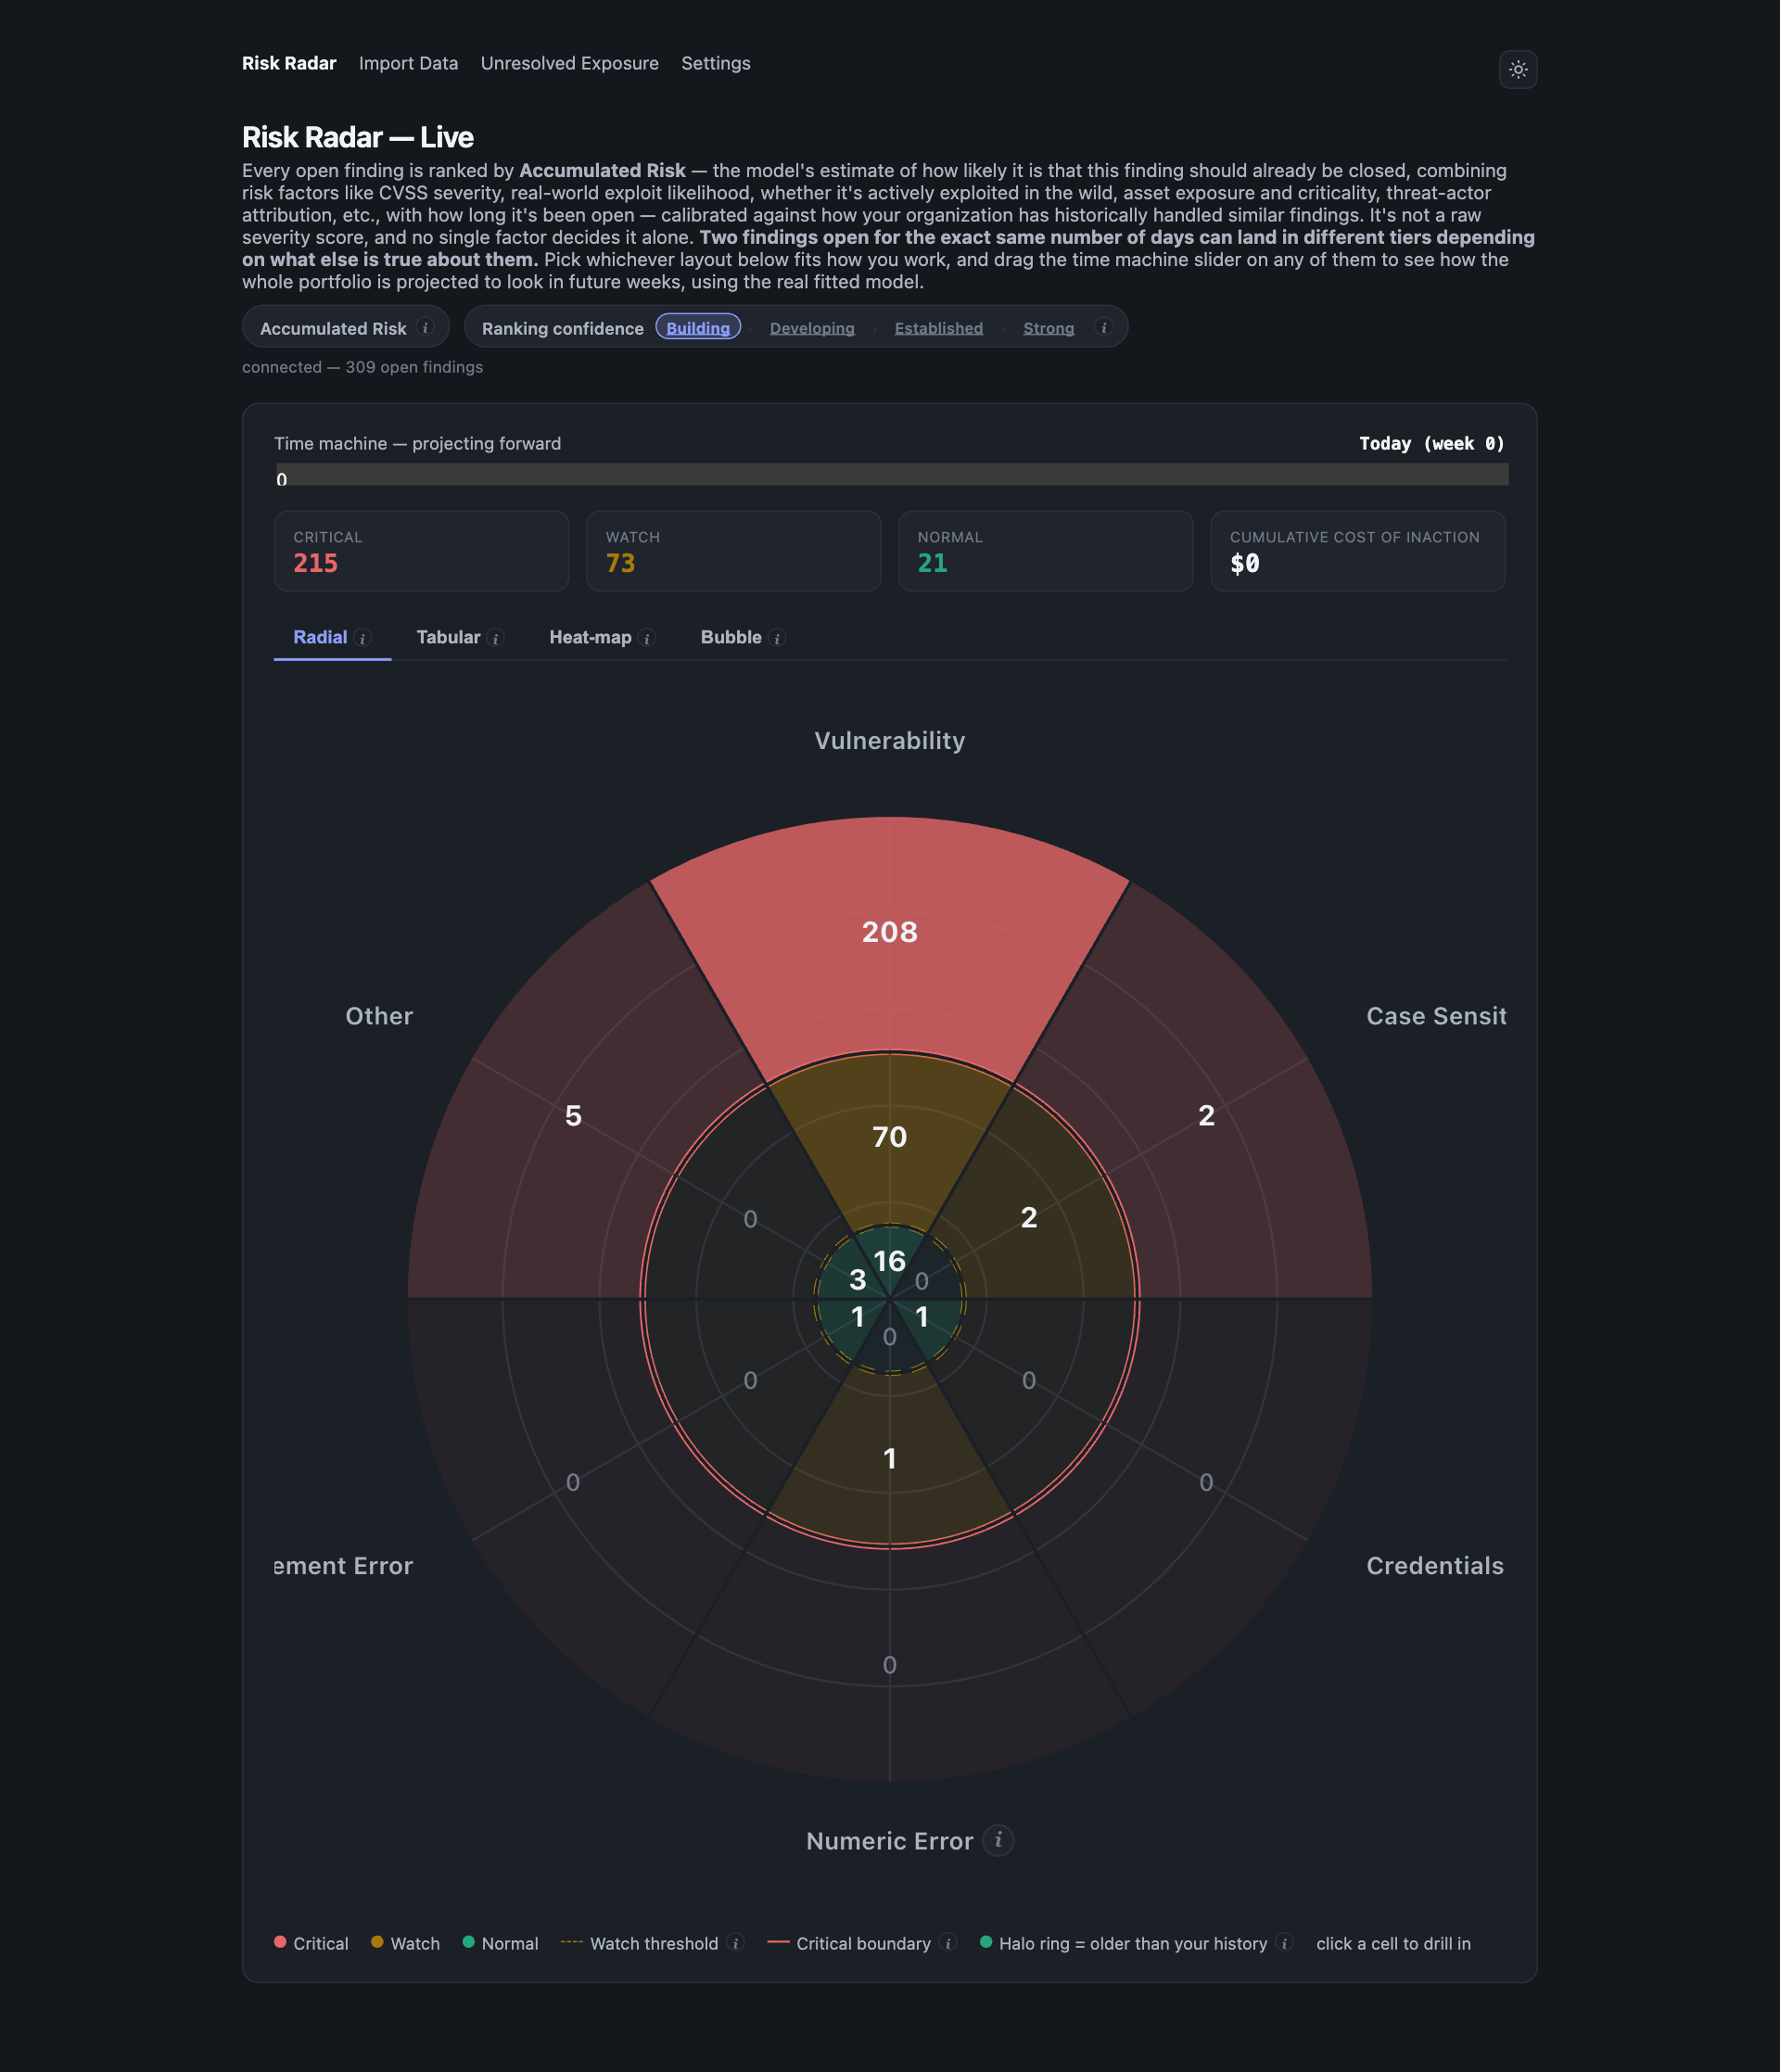
The Radial view. Click any wedge to drill into the findings behind it.
RiskSonar ranks every open finding by how likely it is to already be overdue, based on how your own organization has actually handled findings like it before, not a one-size-fits-all severity label.
Four steps. A machine learning model does the ranking, not a spreadsheet.
Upload your ITSM export. Add an asset fingerprint too, and RiskSonar reads asset criticality and external exposure automatically.
A machine learning model weighs each finding's own severity, exploitability, and exposure, then checks that against how your organization has actually closed findings like it. That's the brain behind every rank, not a fixed formula.
Radial, Tabular, Heat-map, or Bubble: pick the layout that matches how your team actually works the backlog.
See the dollar cost of leaving a finding open, project it weeks forward, and know what's actually worth escalating today.
A real capture from a running RiskSonar environment. Your own categories and counts will look different.
Six things RiskSonar does today, not a roadmap.
One score per finding, blending its own severity and exposure with how long it's been open, calibrated to your history.
Project the whole backlog, or one finding, forward in time using the real fitted model, not a straight-line guess.
A weekly dollar estimate for every open critical finding, built from cost figures you set, not a fixed guess baked in.
Known asset–CVE pairs with no ticket at all, surfaced from your asset fingerprint before anyone even opens one.
Radial, Tabular, Heat-map, and Bubble: the same findings, laid out for whichever way your team scans a backlog.
A plain read on how much closed-ticket history backs the model today, from Building up to Strong. Rises on its own.
Sign in to explore your backlog and see how everything fits together.